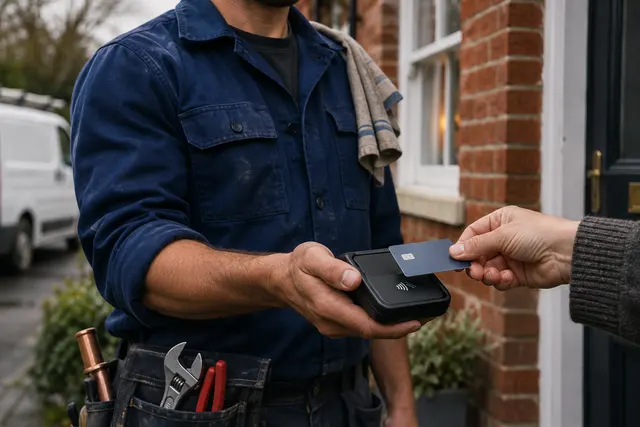
Contactless card transactions made in the UK in August 2026
| Measure | Reported figure | How to read it |
|---|---|---|
| Contactless transactions | 1.61 billion | Number of contactless debit and credit card transactions |
| Value paid contactlessly | £27.1 billion | Total spent using contactless debit and credit cards |
| Share of debit transactions | 77% | Share of the debit payment count |
| Share of credit transactions | 68% | Share of the credit payment count |
What UK Finance counted
The August update counts card transactions made in the UK by holders of UK and overseas cards. It reports the number of contactless payments separately from their total value. Its other series on UK-issued cards also includes spending abroad.
To compare your own checkout with these figures, use the same month, count completed transactions and separate debit from credit. The proportion of transactions paid contactlessly is a different measure from the proportion of sales revenue.
Start with how customers actually pay
List your payment locations: counter, table, customer premises, website or remote invoice. Then note the busiest period, number of staff taking payments and whether receipts, refunds or a till connection matter.
For a shop or café, ask how the proposed terminal fits the queue and staff workflow. For a mobile business, check the connection at the places you trade. If customers pay invoices from elsewhere, consider the remote-payment process separately.
Compare the full cost of your own payments
A contactless percentage does not calculate your merchant bill. Request the rates for the card categories you take, any pence charges, terminal rental, software costs, minimum charges and other applicable fees. Confirm how each charge is billed and keep VAT treatment consistent.
Use card sales and transaction counts from the same period. For seasonal businesses, compare representative quieter and busier months. A low headline rate can have a different effect when average payment size or the fixed monthly cost changes.
A worked example: why payment size matters
At £10,000 in card sales, a £10 average sale gives 1,000 payments. A £50 average gives 200. On a sample tariff of 5p per successful payment, that part of the bill is £50 or £10 respectively.
These figures exclude percentage charges, rental and all other costs. They are not a CardsMachines quote or a saving estimate. If a real agreement bills authorisation attempts or another event, use that actual billable count instead.
Check the commitment before making a change
Confirm the exact equipment, any required till integration, settlement arrangements, support route, minimum term, notice requirements and itemised exit costs. Ask who supplies each part of the service and which agreement governs it.
Compare any quoted costs with your current bill and the equipment and support you actually use. Keeping the existing agreement can make sense.
Common questions
Does 77% mean 77% of UK spending was contactless?
No. It is the reported share of debit card transaction counts. The credit card share is reported separately. Neither percentage is a share of the value of all UK spending.
Which month do these figures cover?
The figures cover August 2026. UK Finance published them on 17 November 2026.
Do the figures prove I will save by changing provider?
No. Compare your actual card mix, billable events, fixed costs and contractual commitment against a complete written proposal.
Sources and dates
Checked 2026-11-19 · Published 2026-11-17
Checked 2026-11-19